Analyze your ANN code with Night System
When I working on a project about ANN, I stucked in code perfomance analyze. nvidia-smi and torch.cuda has very limited information in detail.
I found ptrblck use this to analyze cuda stream, this for gpu workload. Besides, NVIDIA-NSYS user guide offers detailed CLI parameters.
NVIDIA configuration
Full step of Allow profiling of your GPU. I put the linux part here:
Linux and QNX Mobile Only
- Set the support-gpu-tools device tree property in the GPU device node to “1”.
- Recompile the Device Tree following the instructions in the appropriate DRIVE OS SDK Developement Guide:
- DRIVE OS Linux SDK Development Guide
- DRIVE OS QNX SDK Development Guide
- Flash updated DTB.
- GPU Debugger and Profiler support should be enabled now.
1. Code API
1.1 Start and Stop
torch.cuda.cudart().cudaProfilerStart()
# your gpu code
torch.cuda.cudart().cudaProfilerStop()
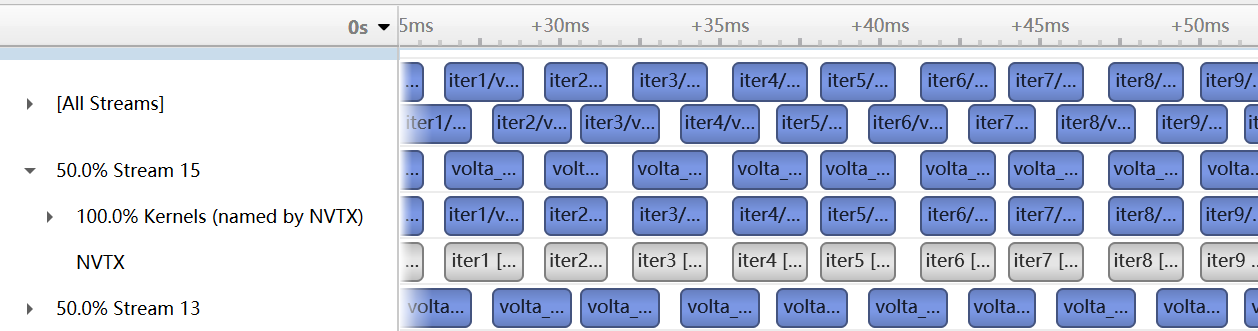
1.2 GPU code division
iters = 999
s1 = torch.cuda.Stream(device=device)
s2 = torch.cuda.Stream(device=device)

for i in range(iters):

    torch.cuda.nvtx.range_push('iter{}'.format(i))

    with torch.cuda.stream(s1):
        # do something in steam 1
        pass

    with torch.cuda.stream(s2):
        # do something in steam 2
        pass

    torch.cuda.nvtx.range_pop()
2. Run your code
Detailed CLI doc here offers detailed CLI parameters.
This is a ready-to-go command your can have a try.
nsys profile -w true -t cuda,nvtx,osrt,cudnn,cublas -s cpu --capture-range=cudaProfilerApi --stop-on-range-end=true --cudabacktrace=all -x true -o <file-name> --force-overwrite true --gpu-metrics-device=<GPU bus id> <python> <script.py>